Part IV. Value, measurement and more than one team
How to know if AI pays off
Measure and improve: DORA, flow, EBM and the data-driven Sprint Retrospective
Two measured Sprints
Begoña asked the committee whether AI was paying off. The GymApp team had the answer everyone gives: "we're going much faster." Ramón asked Olga for numbers.
Olga didn't have numbers; she had impressions. So she proposed something modest: measure two Sprints before changing anything else. How long an item took from the moment work started until it reached the members, how many changes went to production, how many had to be fixed afterwards, how much work was half done, and what the members did with what was released.
The data said something different from the impressions. The team was finishing more items than before, but the time until they reached the members had barely dropped, because they sat waiting for review. And one in five changes needed a fix the following week.
What not to measure
Some measures offer themselves up and say nothing about value: lines of code written, changes delivered, number of AI queries, "active users of the tool," or self-reported hours saved. They are easy to count and easy to inflate. If they become a target, people move them.
The feeling is not data
The feeling of going faster is real, but it isn't enough. In 2025, the organisation METR used a controlled experiment to measure experienced developers working on their own open-source projects. With AI tools they took 19% longer. Before starting they expected to be 24% faster, and when they finished they still believed they had been 20% faster.
It doesn't mean AI always slows you down. It means the impression of the person using it is not a measurement. You have to look at the flow.
The minimum dashboard
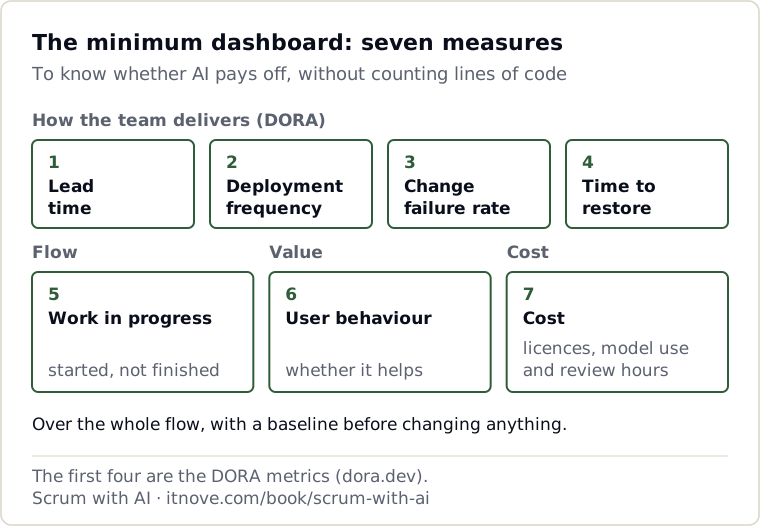
Seven measures are enough to start:
- Lead time: from when something is started until it reaches the user.
- Deployment frequency: how often something goes to production.
- Change failure rate: what share of changes needs a fix afterwards.
- Time to recovery: how long it takes to fix what fails in production.
- Work in progress: how many things are started and not finished.
- A user behaviour measure: the one that tells you whether what you delivered is useful. In GymApp, bookings per new member in their first month.
- Cost: licences, model usage and review hours.
The first four are the DORA metrics, from the report we cited in chapter 2. The fifth comes from flow management. The sixth is the one that connects to the goal ladder in chapter 12. The seventh is the one senior management asks about.
And they are measured across the whole value stream, not just the team's part. A lead time that only counts development hides the waits from chapter 13.
Without a baseline, any improvement is an opinion
The most useful part of Olga's proposal was changing nothing for two Sprints. Without a baseline, any improvement is an opinion. With one, every change in the way of working becomes an experiment: you change one thing, measure it and decide whether it stays.
Continuous improvement with AI
AI also helps improve how you work, not just do the work:
- The data-driven Sprint Retrospective. AI analyses the Sprint (where work waited, what went backwards, which reviews piled up) and the team decides what to change, using the three questions from chapter 4.
- One-Sprint experiments. One change, one measure and one decision.
- Quality guardians as routine. Agents that review every night what has come in and flag what they can prove.
On our website, the quality guardian also does a post-mortem of every fix: what caused it, who found it, whether it came with its test and whether the same bug exists somewhere else. And it checks that things that should run on their own show signs of life.
The bugs that cost us most were silent: a form in the EU AI Act checklist that couldn't be submitted for four months, or some five hundred pages with their fonts blocked by a security rule, without anyone noticing. Since we started measuring, those bugs show up the next day.
In short
Don't measure what is easy to inflate. The feeling of going faster is not data. Seven measures across the whole flow, a two-Sprint baseline, and continuous improvement as a series of experiments.
Try it this week
Measure two Sprints before changing anything else, with the seven measures, even if it's by hand in a spreadsheet.
In the DORA and flow metrics cheat sheet (in Spanish) you'll find the definitions on one page and the charts worth looking at.